The following steps describe how to debug custom analysis criteria using VS Code.
Create a file named launch.json in a folder called .vscode at the root of the criterion folder.
Enter the args (command-line arguments):
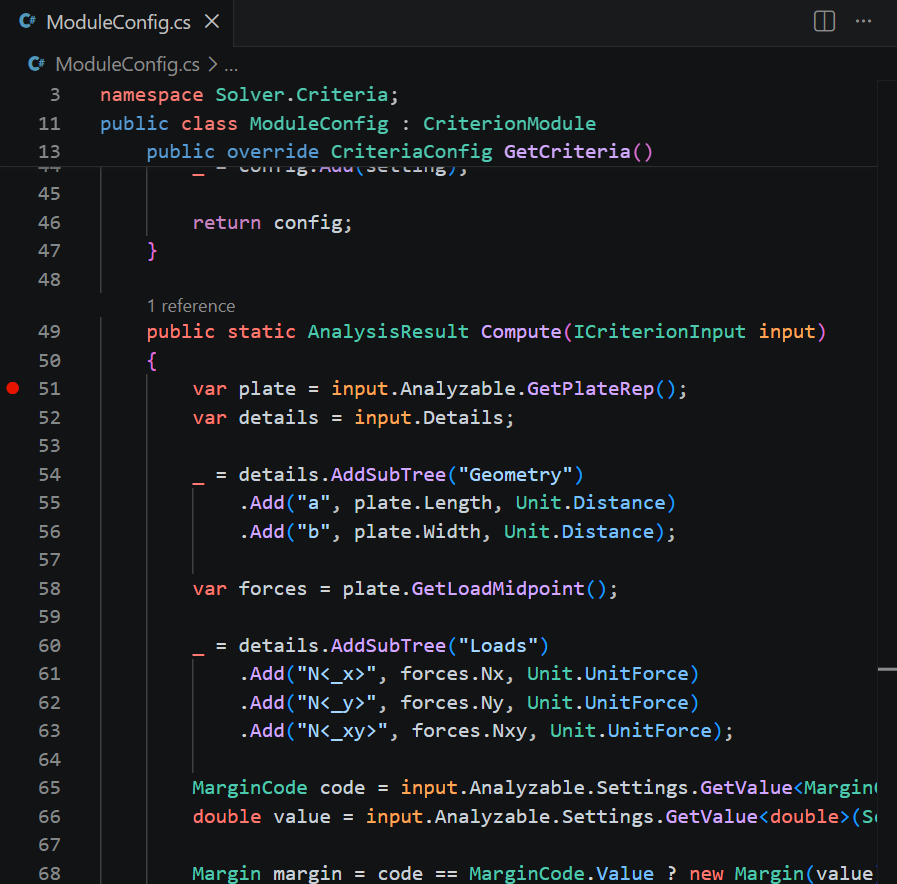
Set a break point in your criterion. For example, break once execution enters the Analyze function.
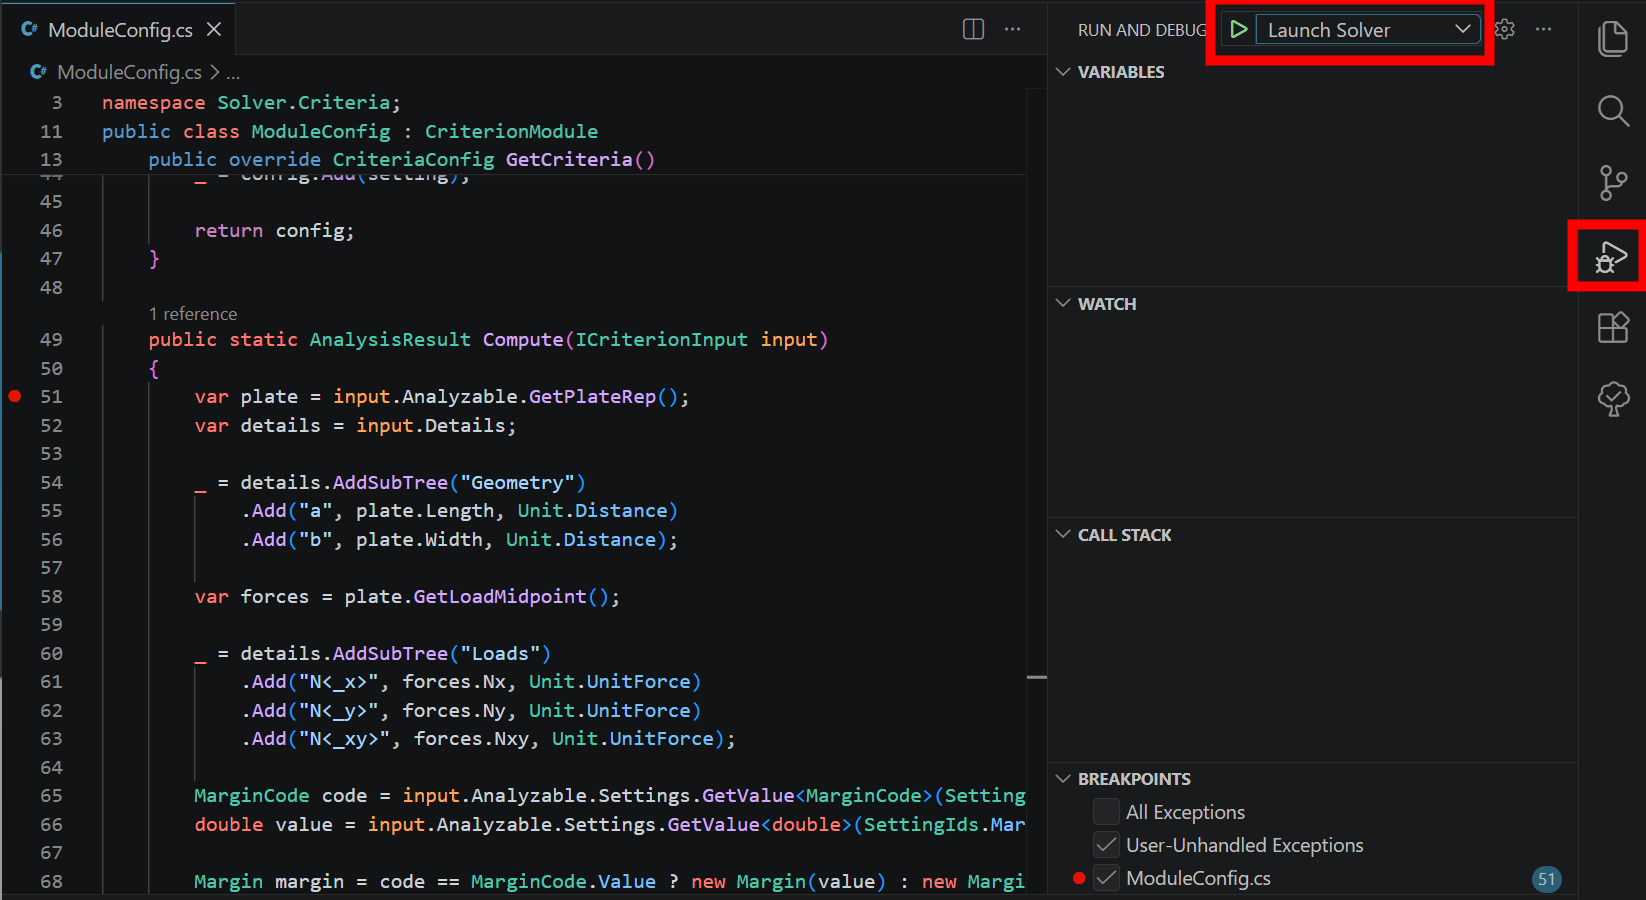
From the Run and Debug side bar, select the Launch Solver debug configuration.
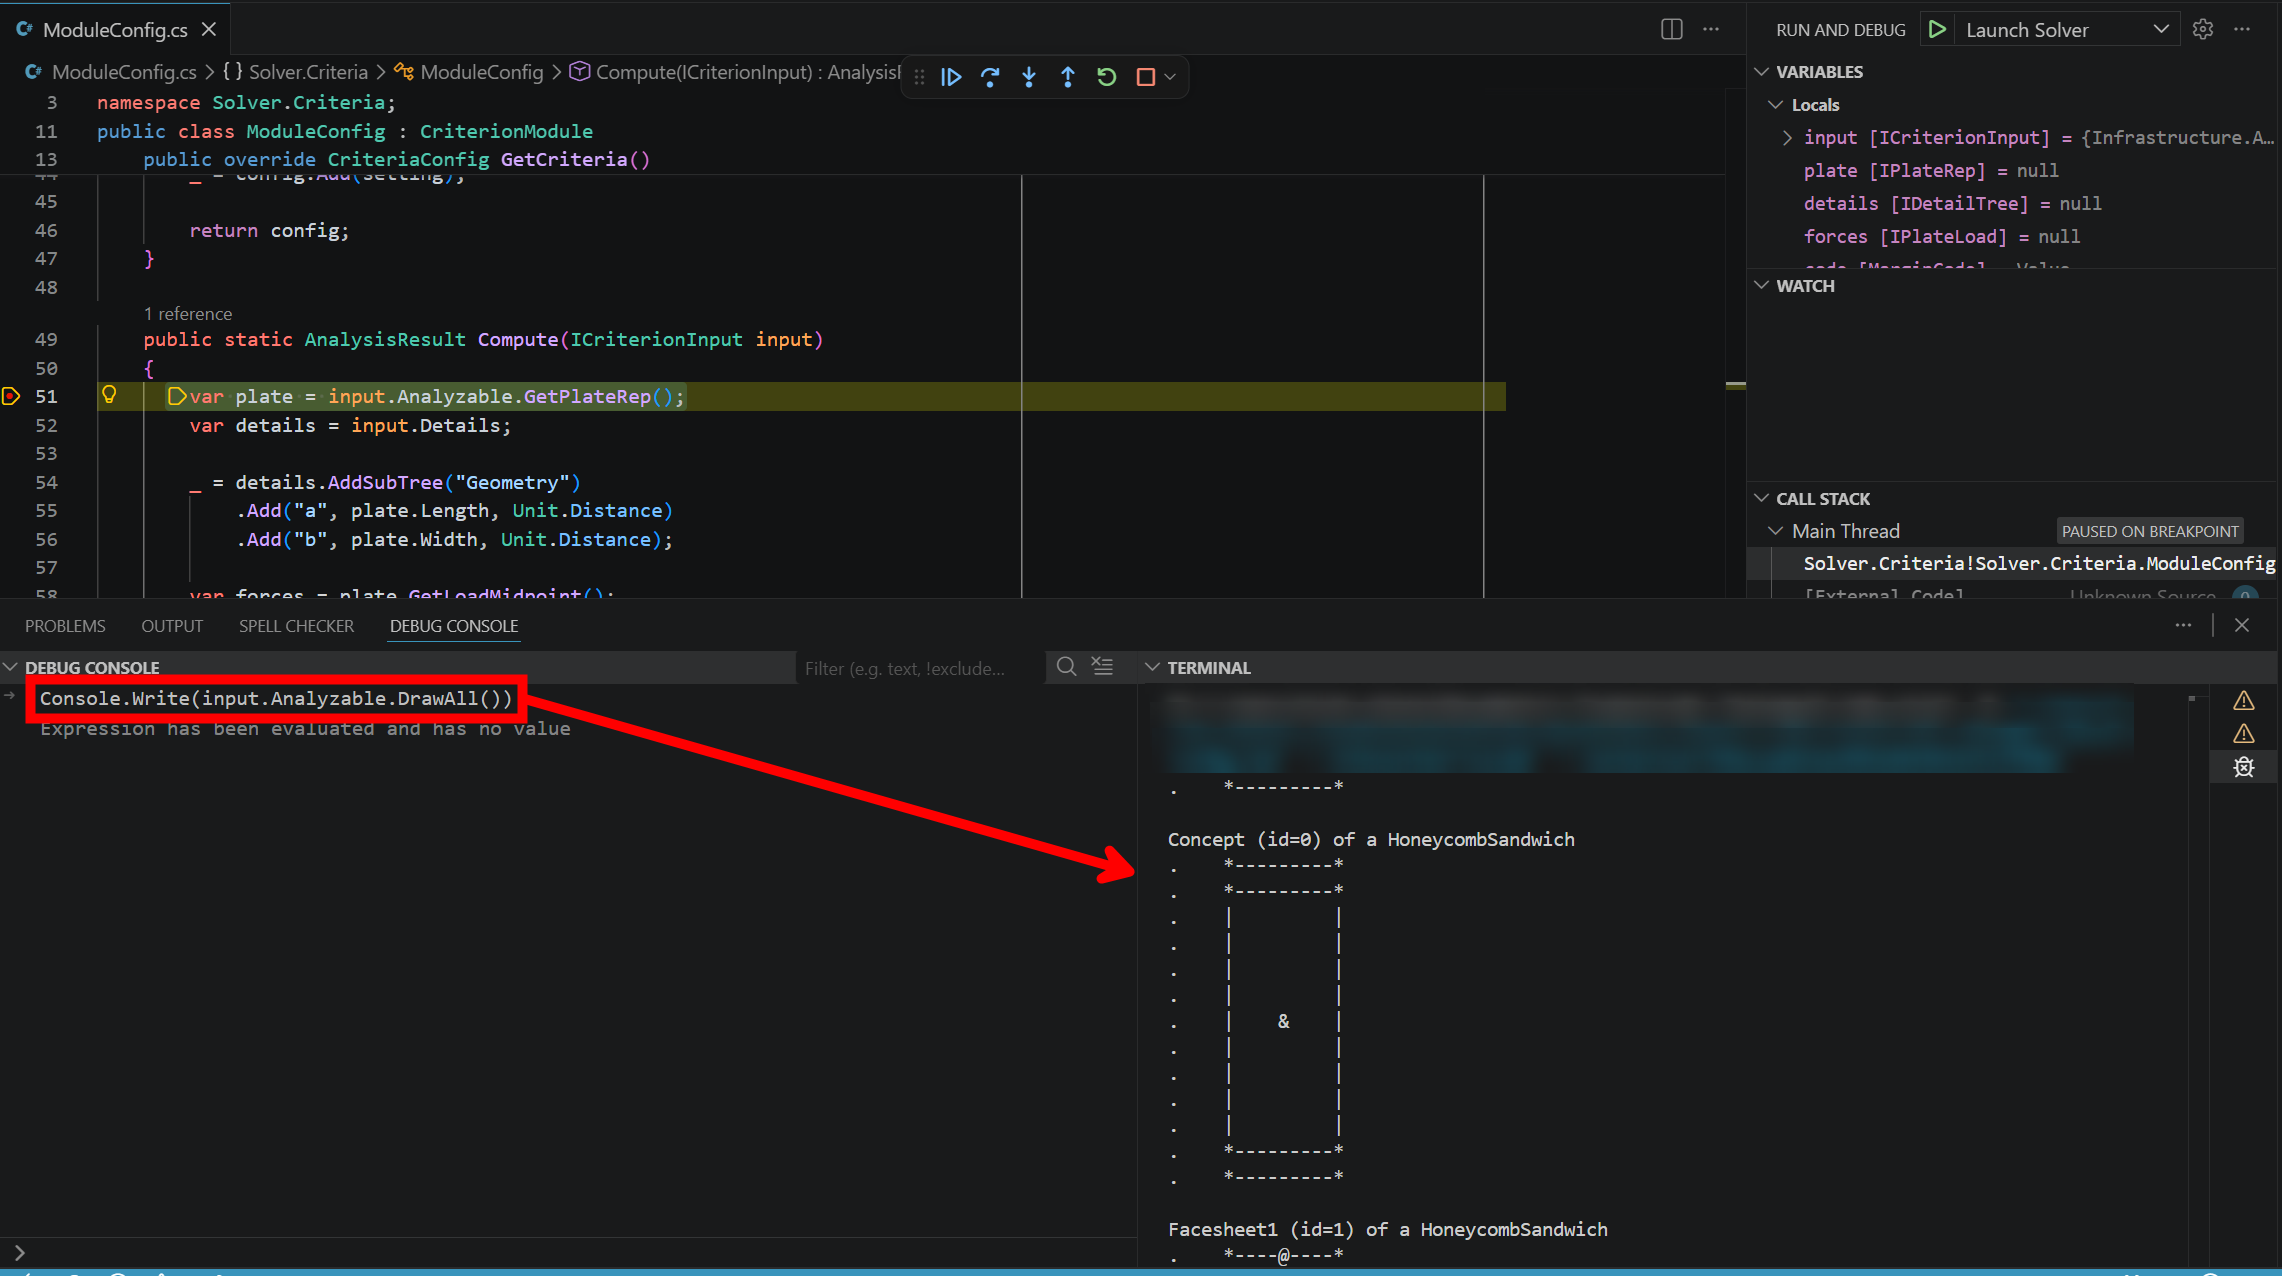
Start debugging. Once the breakpoint is hit, use the Run and Debug side bar or the Debug Console to inspect variables or test commands. For example, the input analyzable's concept and children cross-sections can be output to the terminal using Console.Write(input.Analyzable.DrawAll()).
 1.18.0