The HyperX Solver Application Programming Interface
Loading...
Searching...
No Matches
Debugging: Visual Studio
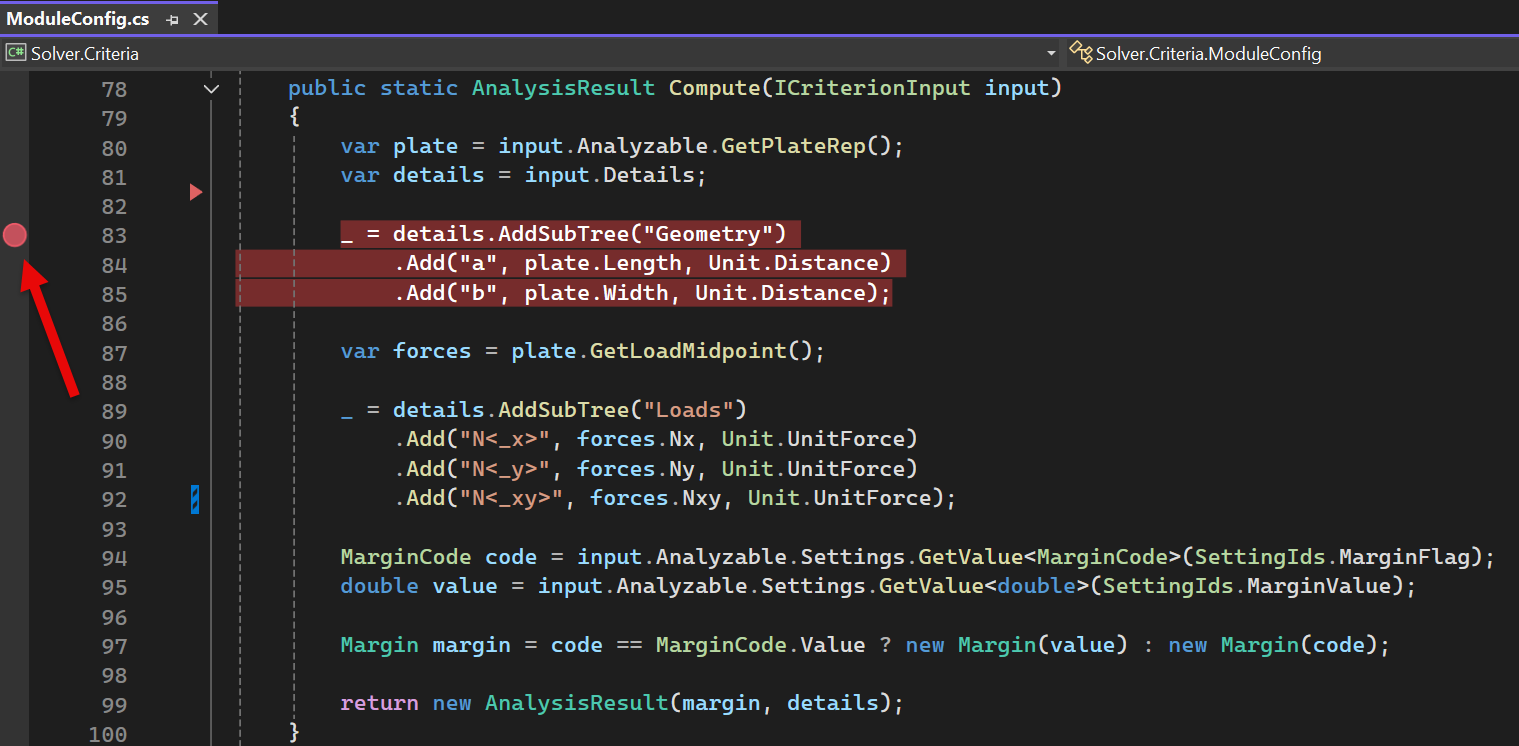
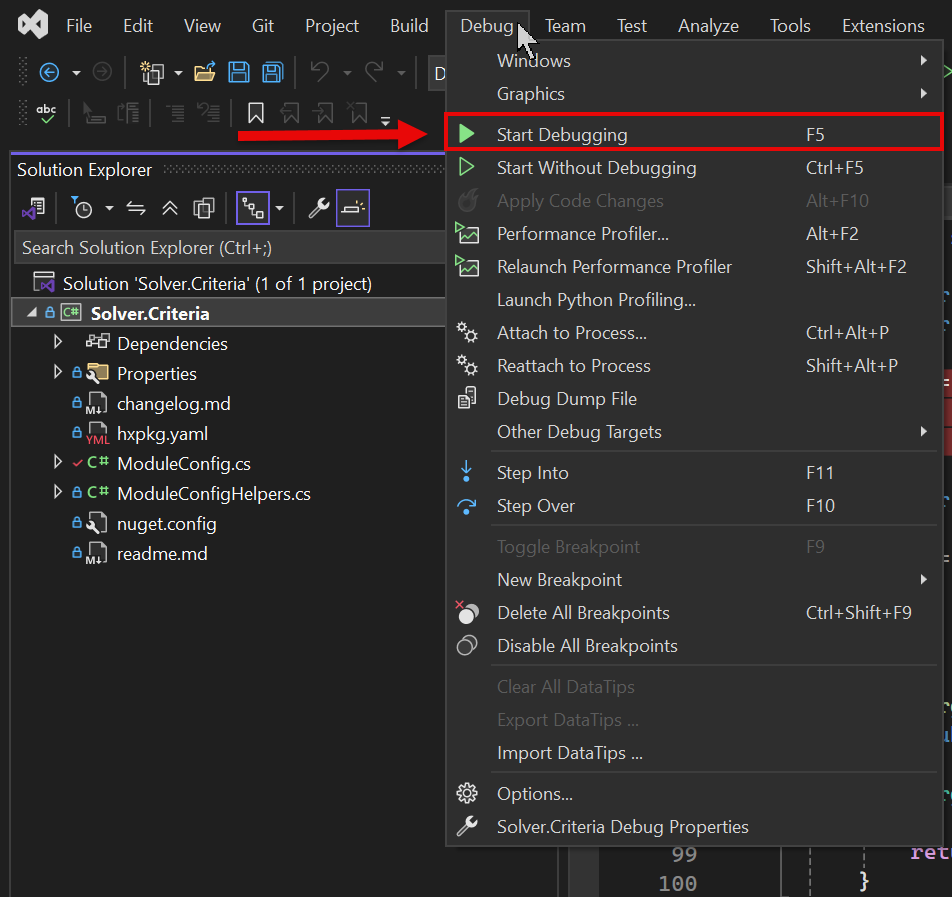
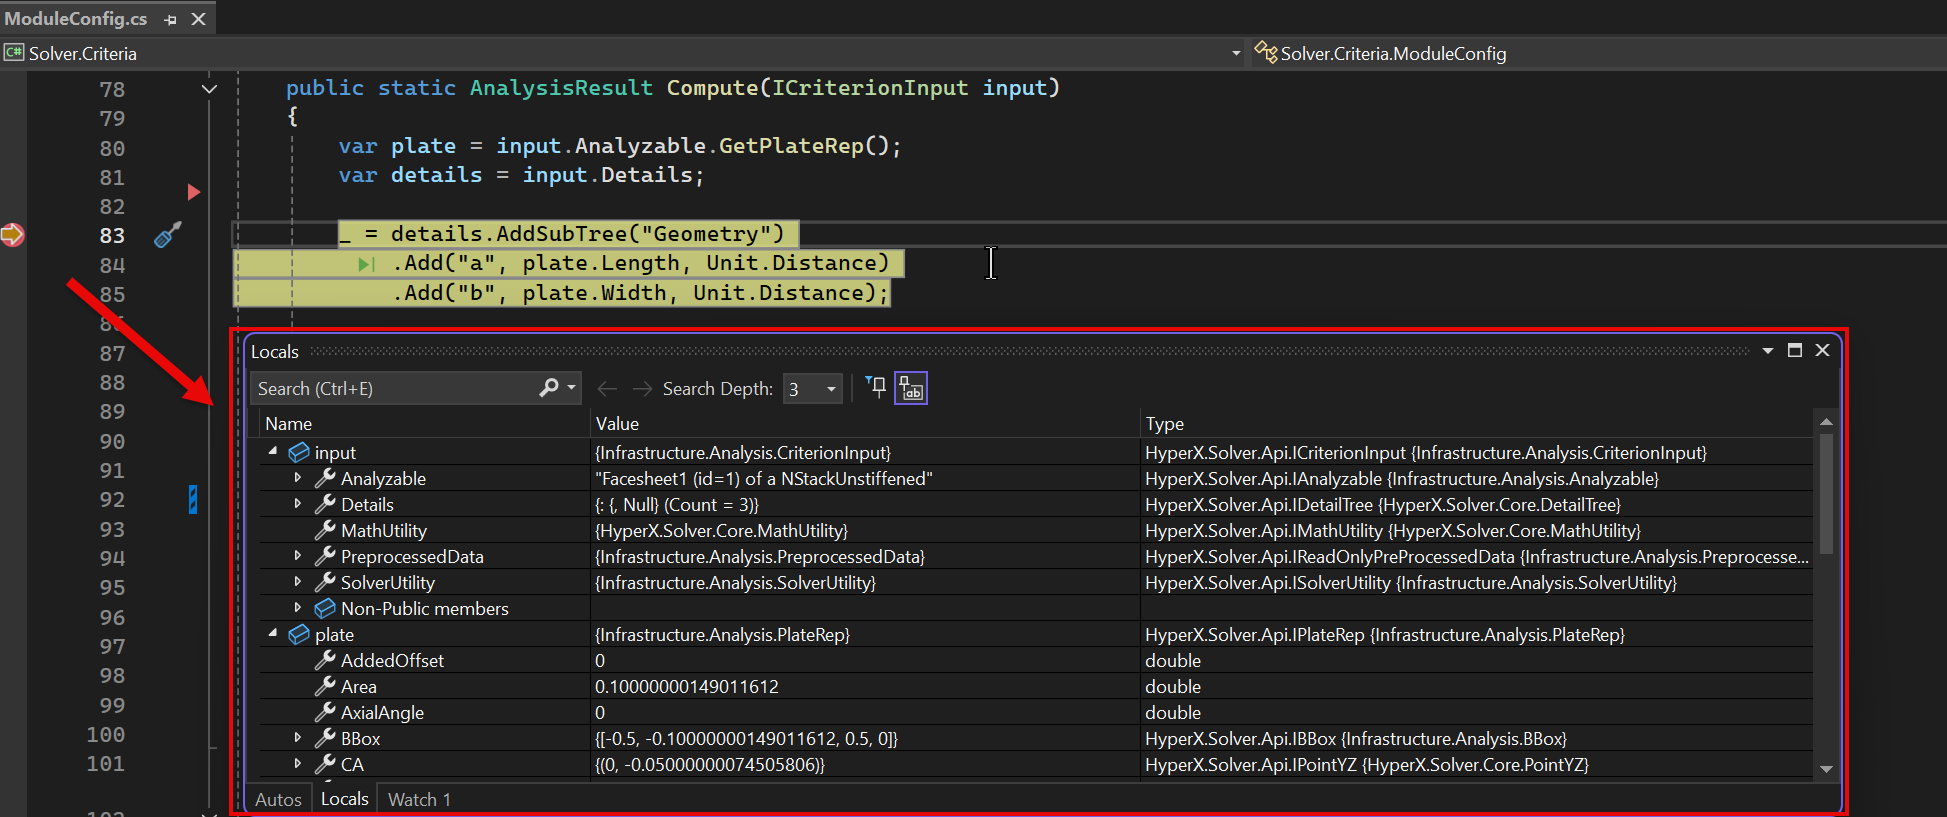
The following steps describe how to debug custom analysis criteria using Visual Studio 2022. The general process is similar in other IDEs and debuggers.
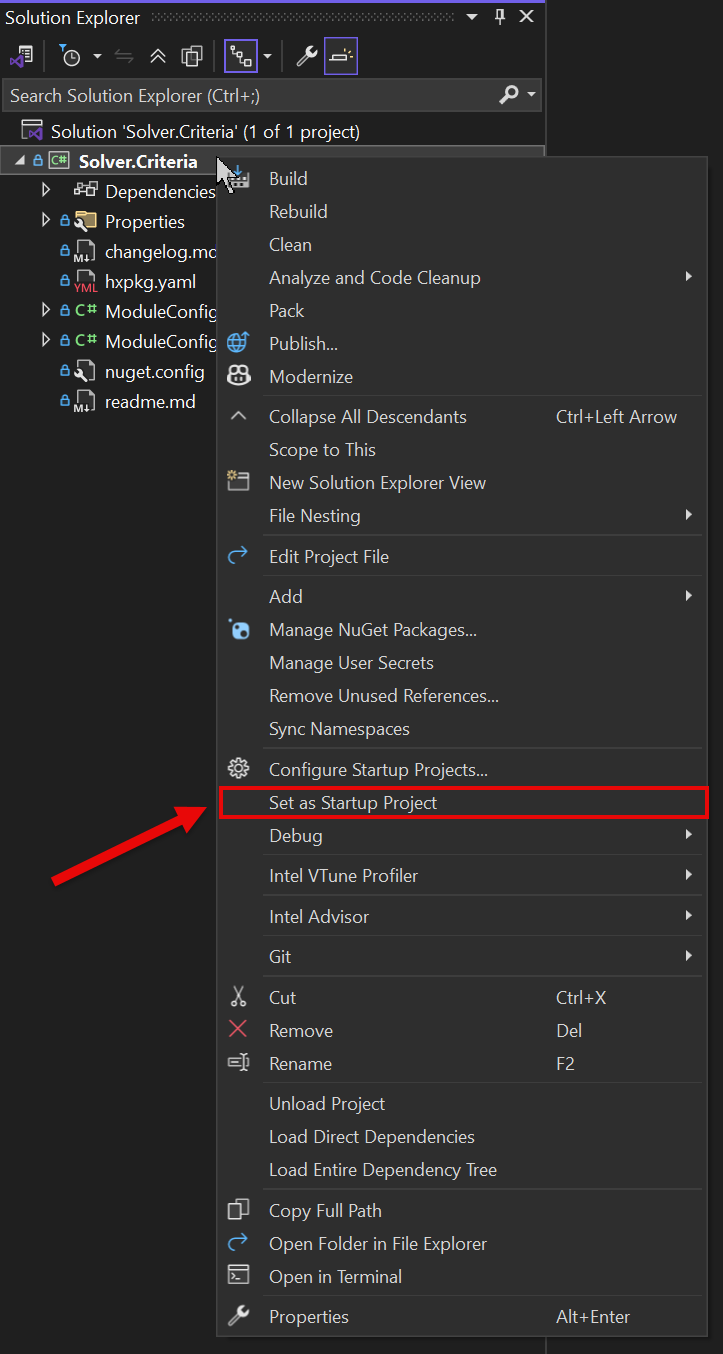
In Solution Explorer, right click your custom criteria project and select Set as Startup Project.
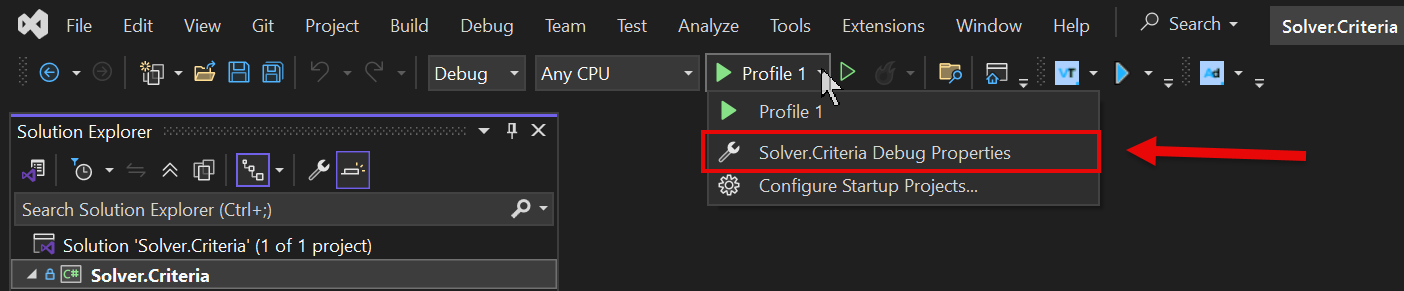
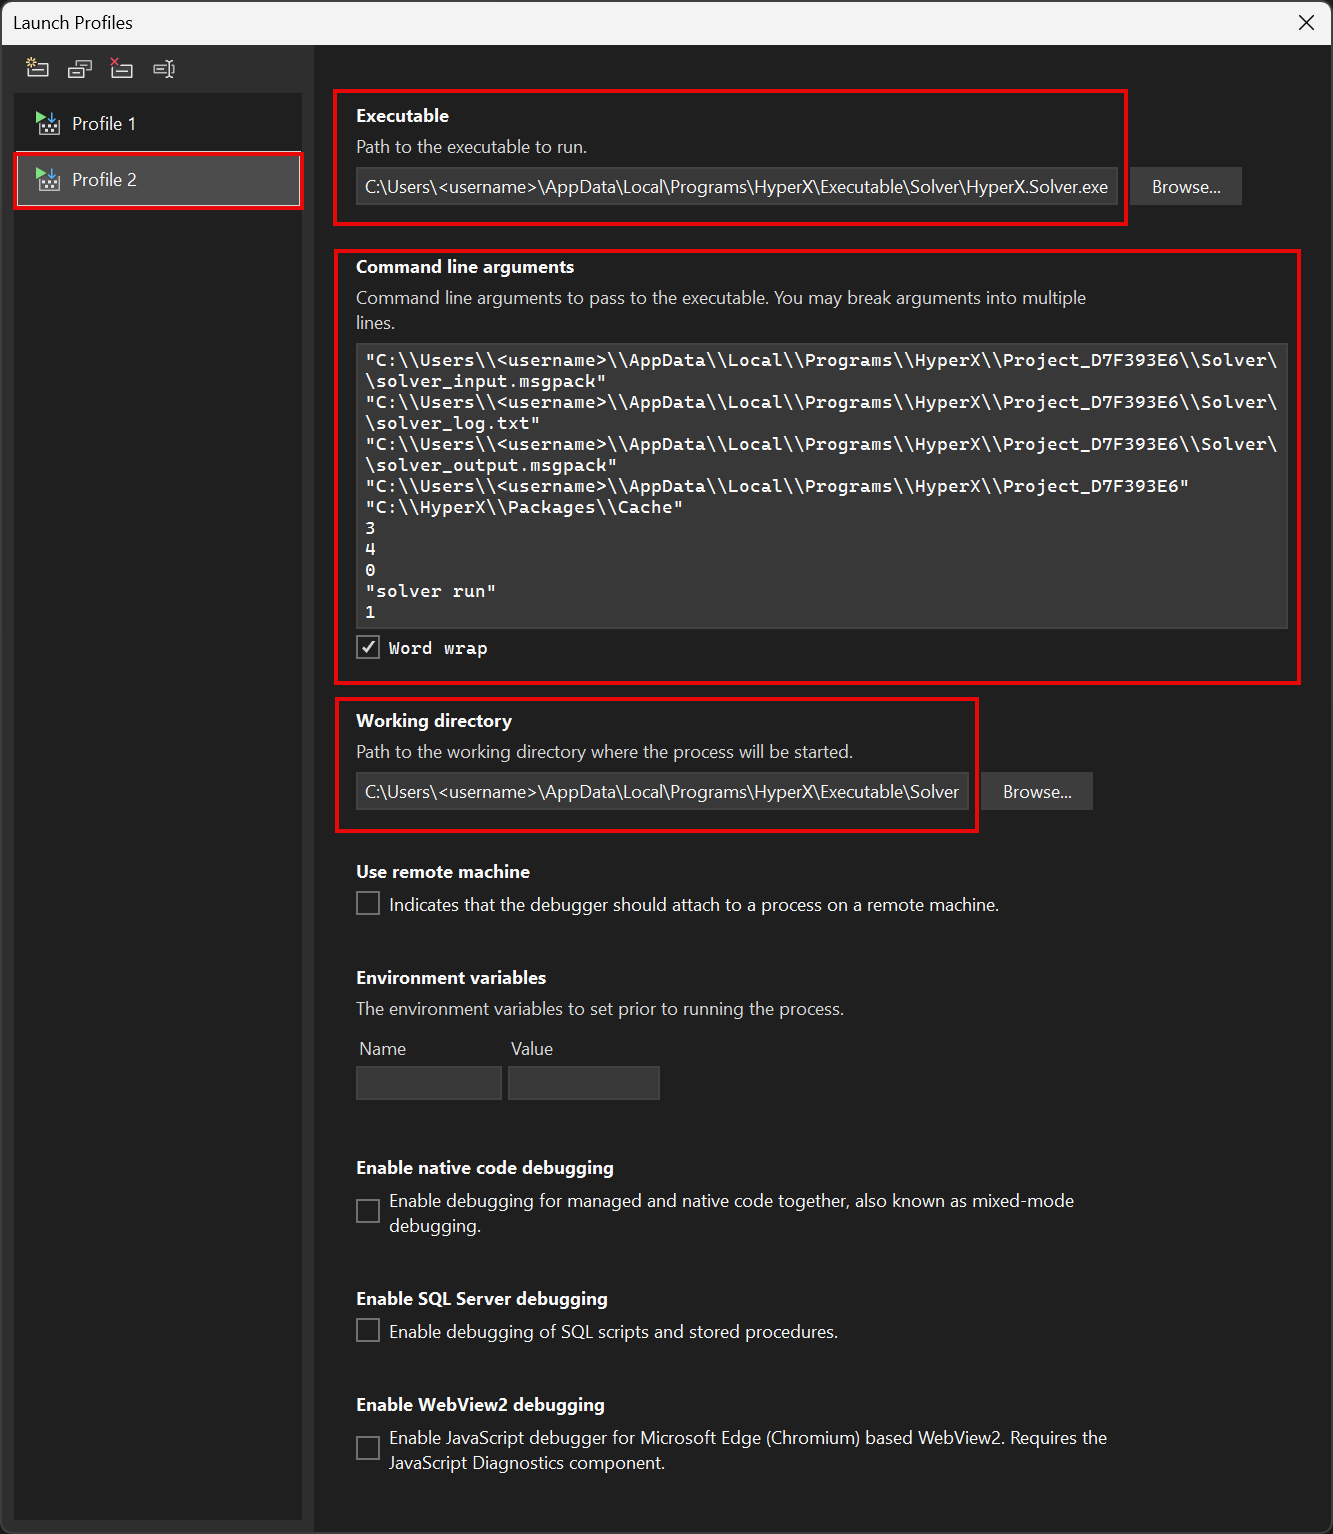
Select your project's Debug Properties to open the Launch Profiles UI.
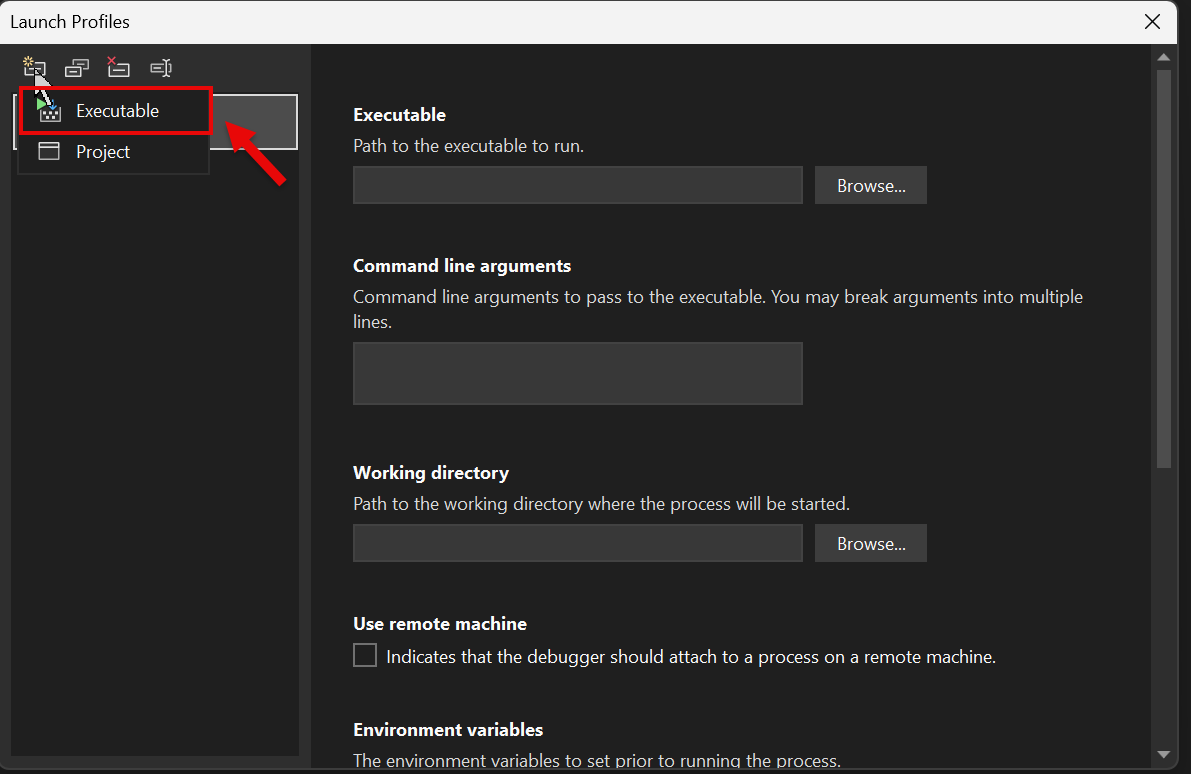
Create a new profile of type Executable.
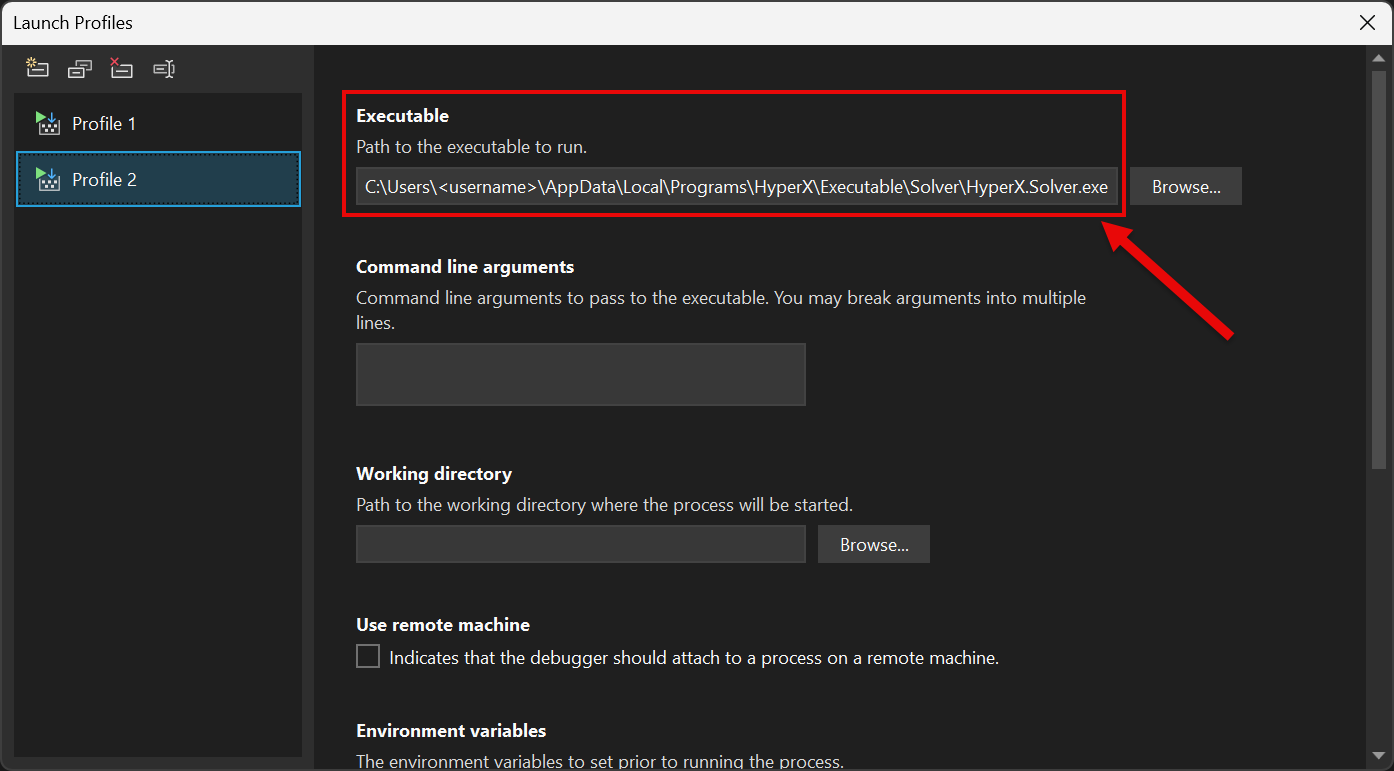
Set the Executable path to: <InstallDir>\Executable\Solver\HyperX.Solver.exe
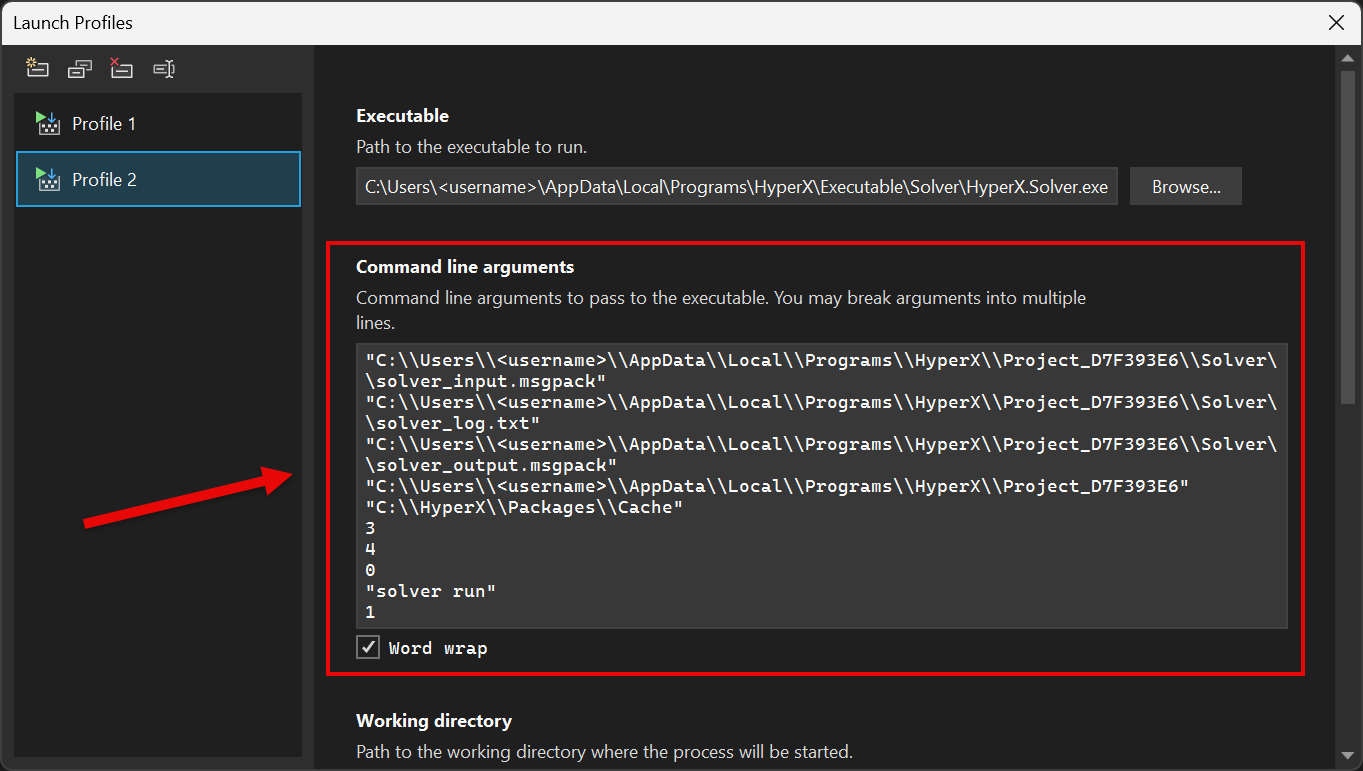
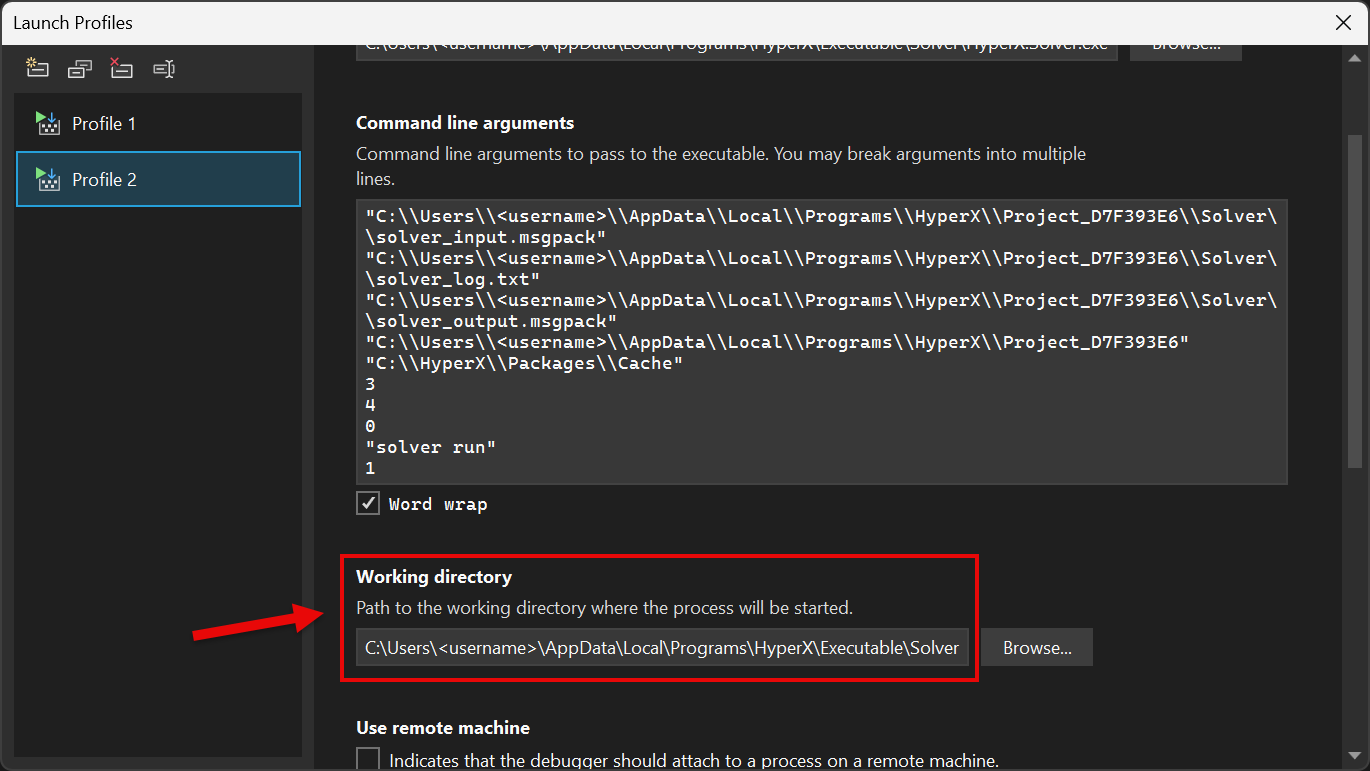
Enter the Command-line arguments:
<input file> — Path to the solver_input.msgpack file ("<ProjectWorkingFolder>\Solver\solver_input.msgpack")
<status file> — Path to your solver_log.txt file ("<ProjectWorkingFolder>\Solver\solver_log.txt")
<output file> — Path to your solver_output.msgpack file ("<ProjectWorkingFolder>\Solver\solver_output.msgpack")
<working folder> — Path to your overall temp directory ("<ProjectWorkingFolder>")
<package cache directory> — Path to your package cache directory ("C:\HyperX\Packages\Cache")
<input file format> — Specifies the input file format. Must be set to: 3 (MessagePack)
<output file format> — Specifies the output file format. Must be set to: 4 (SQL)
<output mode> — Specifies the output mode: 0 (Overwrite) or 1 (Append)
<run name> — User-defined name for the Solver run
<number of threads> — Number of threads to use (must be ≥ 1)

 1.18.0